
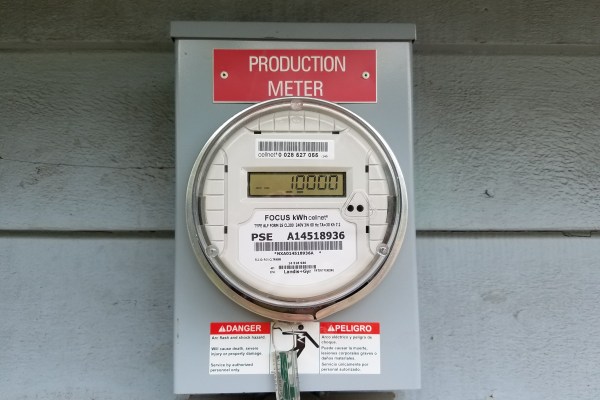
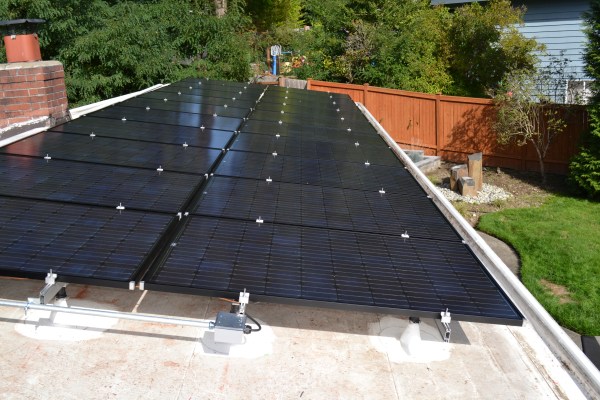
November through February are pretty dark months in Seattle. Often you’ll leave for work before the sun comes up, and return home after the sun goes down. You might get a sunny week or two in January, but most years February’s got you searching for clinical definitions of Seasonal Affective Disorder.
Because my solar array was installed last fall, I have been paying extra close attention to insolation statistics through this period, the darkest third of the year. I now have data for four full months of operation, which should essentially tell me the worst news I can hear about how my solar array is performing.
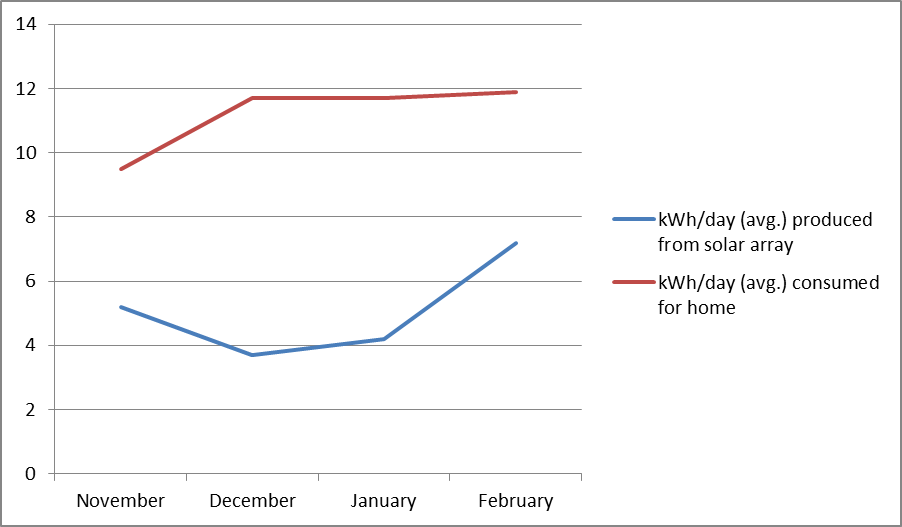
February has been the best month so far, with roughly 61% of our electricity needs powered by the solar panels. By contrast, December’s solar output offset only 32% of our electricity. Overall, we are seeing approximately 45% of our demand being supplied by solar power, with an average daily output of about 5 kWh from the renewable energy source.
At some point this summer (July? August?) I bet we’ll see a crossing of those lines on the chart, indicating that solar is providing full coverage of my electricity and then some. That said, this exercise has been a good reminder to me to work on limiting my consumption, at the same time as I cross my fingers for sunny days ahead.

