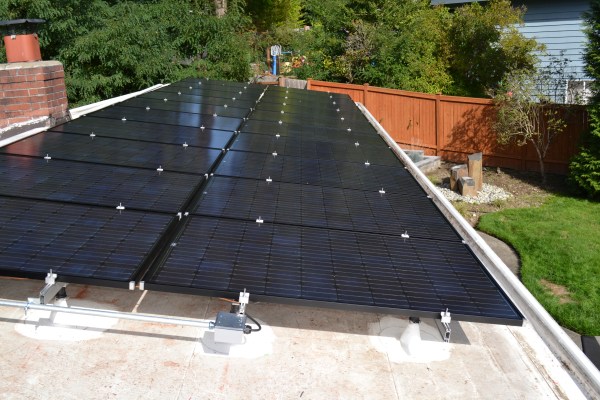

The data evidence is in, and it shows that solar panels have reduced my energy bills by 71 percent, with greater reductions expected for calendar year 2016.
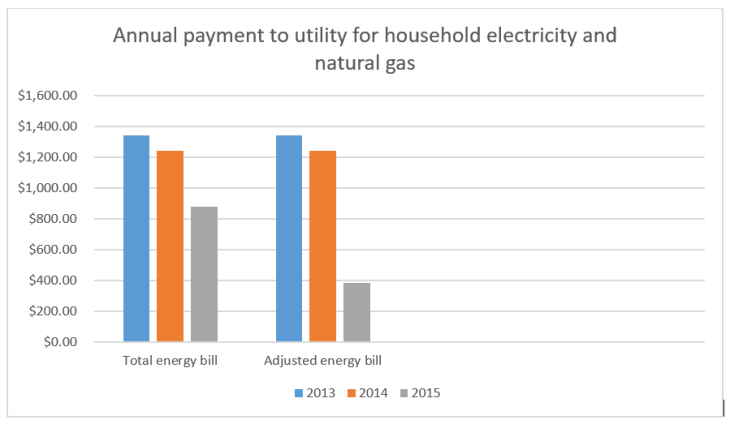
Comparison of annual bills paid to Puget Sound Energy, 2013-2015. “Adjusted energy bill” refers to the amount paid after the solar production payment is factored in.
In 2013, the last calendar year in which I didn’t have the solar array, my bill from PSE totaled $1343.05, for electricity and natural gas (the furnace and water heater are powered by natural gas).
In 2014, which saw the installation of the array in October, my bill from PSE totaled $1240.85. This was down approximately 8 percent from the previous year, a decrease possibly (although not definitively) associated with the transition to solar for my electricity.
And in 2015, the first full calendar year in which the solar array was operative, my bill from PSE totaled $881.26. This figure is down approximately 29 percent from the previous year, and 33 percent from 2013. This shows the impact of the solar panels in and of themselves, and while it is not as dramatic a reduction as I had imagined it might be, the reason for this is clear. Heating in winter is easily the costliest component of my power portfolio, and this is supplied by natural gas, not electricity.
But if you factor in the solar production payment from 2015, which was $498.30, this offsets approximately 57 percent of my power bill for that year. This “adjusted energy bill,” then, is down roughly 69 percent from the previous year, and roughly 71 percent from 2013.
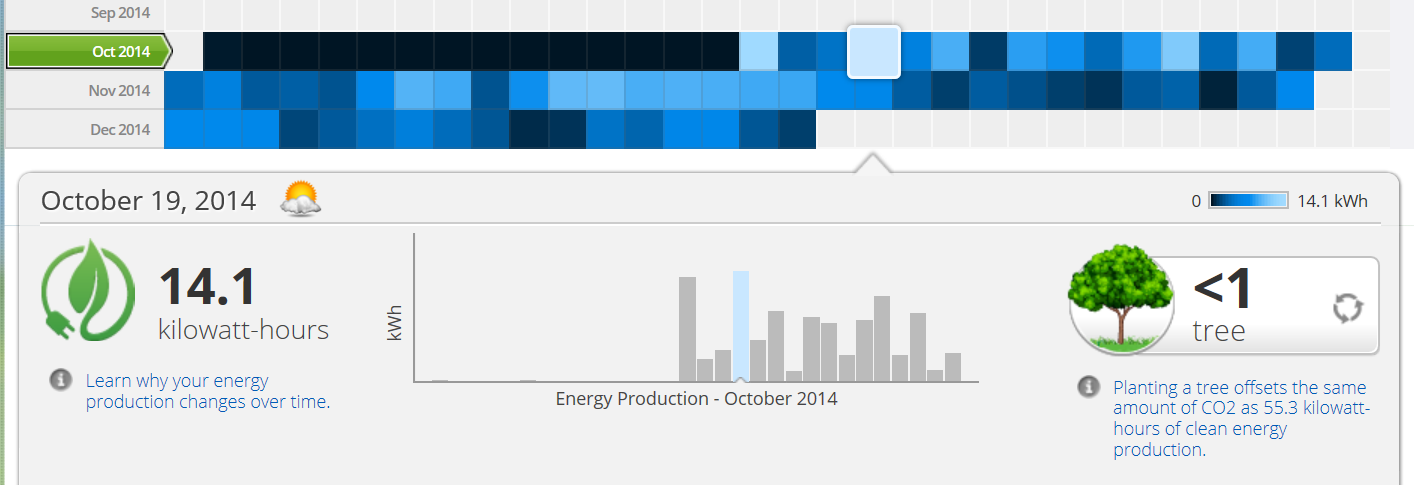
The numbers for 2016 should be even better, with the solar production payment jumping to $738.64, against a total PSE bill probably very similar to that paid last year. Production increased in 2016 to 5276 kWh, over the 2015 total of 3322 kWh. (Note: the 2015 production total was lower because it was based on only nine months of array usage.)
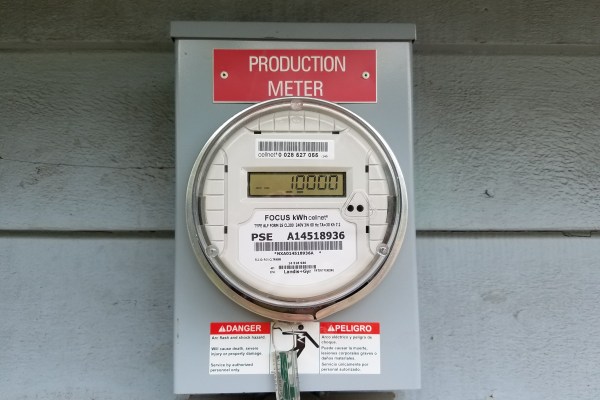
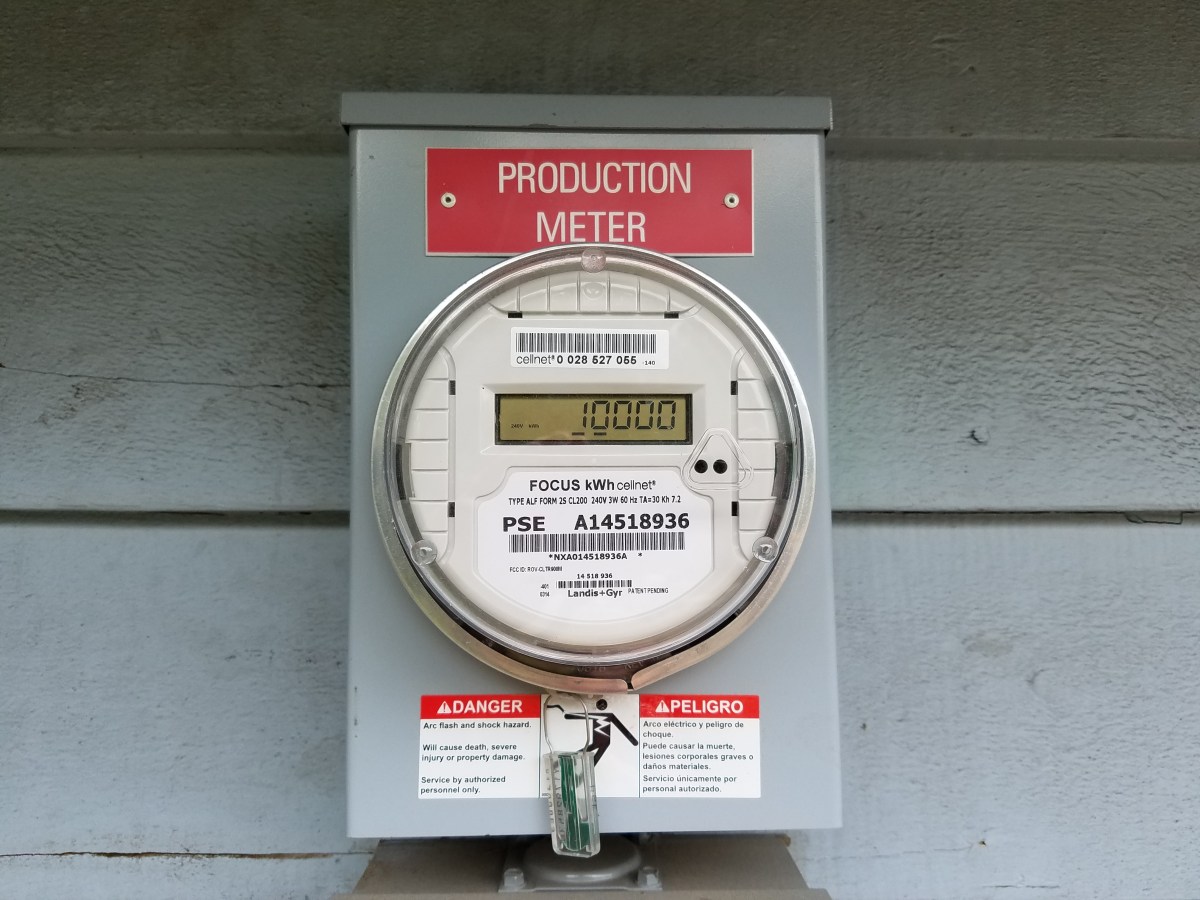
The array also achieved a milestone on August 30 of this year: 10 megawatts (or 10,000 kilowatts) produced in total.